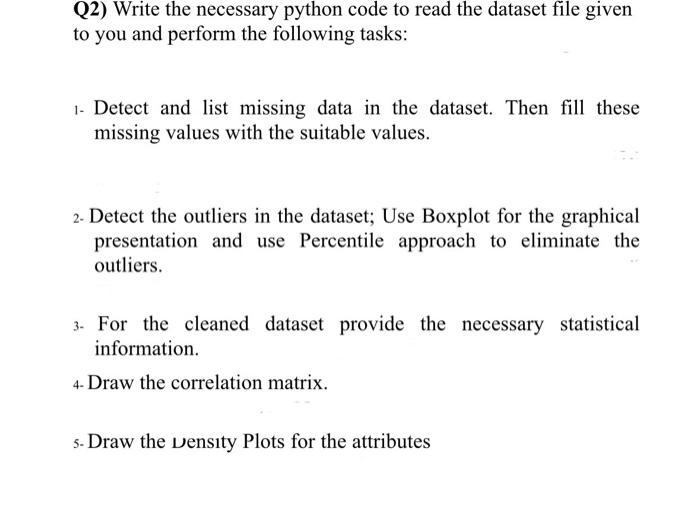
Q2) Write the necessary Python code to read the dataset file given to you and perform the following tasks:
1. Detect and list missing data in the dataset. Then fill these missing values with the suitable values.
2. Detect the outliers in the dataset. Use a Boxplot for the graphical presentation and use the Percentile approach to eliminate the outliers.
3. For the cleaned dataset, provide the necessary statistical information.
4. Draw the correlation matrix.
5. Draw the density plots for the attributes.

 25% off with code “SUMMER”


![Modify your assignment submission code to answer the following questions: 1. Create an interface StudentModel for the student model to store student data you wish to keep unchanged such as studentID and StudentEmail. Modify the existing Student class to implement StudentModel and convert it to an abstract class with the reportReport and deleteStudent as the abstract methods. 2. Consider the following two implementation options for student search for Array and ArrayList respectively. Implement a search without a for loop, you may use methods within the two data structures to optimize the code. public void searchStudent(String searchID) { int foundIndex = findStudentByID(searchID); if (foundIndex != -1) { System.out.println("Student found:"); System.out.println("Student ID: " + studentIDs[foundIndex]); System.out.println("Student Name: " + studentNames[foundIndex]); System.out.println("Student Email: " + studentEmails[foundIndex]); System.out.println("Student Course: " + studentCourses[foundIndex]); } else { System.out.println("Student with student ID " + searchID + " was not found."); } } private int findStudentByID(String searchID) { for (int i = 0; i < studentCount; i++) { if (studentIDs[i].equals(searchID)) { return i; } } return -1; }](https://gotit-pro.com/wp-content/uploads/2023/10/6391b22d-2a52-409f-a111-f25c8a39642d-300x323.png)

![5. Write a program that implements a class called MyTeam. Your class should have the following private data items: Id (int), Name (string), Slogan (string), Wins (int), and Losses (int). You need to define properties with appropriate accessor functions for each of the data items. Methods should include a default constructor that sets values to the empty string or zero, a constructor that allows the user to specify all values for the data items, a member method called DisplayTeamInfo that outputs all the information for the given toy in a reasonable format. Challenge Problem: Code your set accessors to restrict all numeric fields (Id, Wins, Losses) to positive numbers. You can determine how you want to report/respond to the error. (25 pts) The code below is my suggestion for your Main() method for Program 22 static void Main(string[] args) { MyTeam myHitchhikers = new MyTeam(); myHitchhikers.Id = 42; myHitchhikers.Name = "Ford Prefect et. al."; myHitchhikers.Slogan = "Don't panic!"; myHitchhikers.Wins = 525; myHitchhikers.Losses = 42; Console.WriteLine("nTeam 1 Information"); myHitchhikers.DisplayTeamInfo(); MyTeam mykitties = new MyTeam(); Console.WriteLine("nTeall 2 Information"); mykitties.DisplayTeamInfo(); MyTeam myPatriots = new MyTeam(2023, "UC Patriots", "One Big Team", 42, 3); Console.WriteLine("nTeam 3 Information"); myPatriots.DisplayTeamInfo(); //This will test your Challenge Problem Settings if you attempted them Console.WriteLine("nTeam 4 Information"); MyTeam mywinners = new MyTeam(13, "Winners", "We like to win more than you do", -20, -35); } myllinners.DisplayTeamInfo();](https://gotit-pro.com/wp-content/uploads/2023/10/3e8c6678-946b-46ed-9c20-1515f2ff356a-324x229.png)


![6. Write a program to determine the maximum height to which a projectile will travel if atmospheric resistance is neglected, for different initial velocities. This problem demonstrates the use of repetition controlled by a terminating limit. Method: The mass of the projectile is m, the initial velocity is v0 m/sec, the last initial velocity is vft/sec. From equations of motion: w=mg, Fz=maz. Applying these equations for the projectile results in the following equations: mg=mac gives ac=g. Initial conditions: s0=0, v0=v. Final conditions: sf=h, vf=0. From Kinematics: vf2=v02+2ac(sfs0) 0=v2+2ac(h0) 2ach=v2 h=2acv2 Data: Real values of initial velocity at 50, 100, 150, and 200 ft/sec. The real value of gravitational acceleration is 32.2 ft/sec2. 7. Write a program to compute and print a table of torsion shear stresses for circular rods having various torsion loads at various offsets. This problem demonstrates the use of nested repetitions. Data: Diameter: 5 and 6 inches. Load: 1000 and 12,000 pounds. Offset: 10, 15, and 20 L. Method: Let D = diameter of the rod. P = torsion load in pounds. L = offset. The torsion shear stress is given by the formula Ts = D^3/(16PL). 8. Write a program that reads numbers from an array and graphs the information in the form of a bar chart or histogram. The number is printed first, and then a bar consisting of that many asterisks is printed beside the number. Note: The define size of the array is 10. Example: [Number]: ********** [Number]: * [Number]: ********* [Number]: ***** [Number]: ********** [Number]: **** [Number]: ** [Number]: ******* [Number]: ******** [Number]: *******](https://gotit-pro.com/wp-content/uploads/2023/10/6c588a25-0ba0-4cf2-9cb7-5cd4974446e7-300x838.png)


Gordon Benton –
Thanks a lots, I really appreciate your effort it is an excellent report.
Chris Sims –
Excellent job, my friend. Thank You!!
Scott Slater –
The assignments I submit are always of great quality and completed on time.
Alice Elkins –
I highly recommend this website. It is definitely the best.
Greg King –
It was quality work and in a timely manner. It was the help I needed at the time, and I appreciate it so very much.
Doug Okruch –
Follows the required notes. Right on time. Amazing solution.