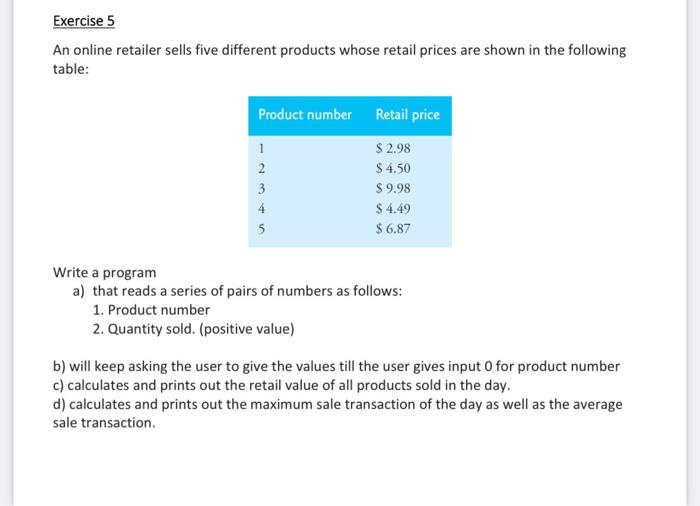
HW-1: Write a Matlab function that calculates the factorial of a number using the flowchart given below. Run the function in the command window. Submit the code and a screenshot of your result in the command window as a single pdf document to Yulearn. Note: the name of your file cannot be “factorial” as it is Matlab.
![Exercise 4A Write functions to perform the following tasks efficiently. Do not change the function names in the template file, and do not import any packages besides those already indicated in the template. (1) Take x and return 2x^3. (2) Take two inputs x and y and return their product and the absolute value of their difference, in that order. E.g. inputs 3,4 should return 12,1. (3) The geometric mean of n numbers is the nth root of their product. The mid-range is the ordinary (arithmetic) mean of the maximum and minimum elements. Write a function which takes a list of numbers as input and returns True if the geometric mean is less than or equal to the midrange, and False if the geometric mean is greater than the midrange. For example, the input [3,8,9] should return True and [3,6,7,5] should return False. (4) Take an integer n and return a list of the first n terms of the Padovan sequence pn. (This is a variant of the Fibonacci numbers, defined by p[1] = p[2] = p[3] = 1, and p[n] = p[n-2] + p[n-3] for n>=4.) (5) Take a pair r0 and theta representing a point's polar coordinates and return a pair (x,y) representing its Cartesian coordinates. (6) Take a pair (x,y) representing a point's Cartesian coordinates and return a pair (r, theta) representing its polar coordinates, where theta is in the range [0,2π). Check that your function works for (x,y) in all quadrants.](https://gotit-pro.com/wp-content/uploads/2023/10/69b0fd8b-79ad-4a6a-ac52-c635ef316302.jpg)

![Test Your Antarctica Water Segmentation Function Create a function to segment the Antarctica ice shelf images using the Color Thresholder app as described in the previous reading. You can use this function to calculate the increase in visible water between the two images. Copy the code from your generated function into the first code box below. We've provided a function name for you below, segmentMeltwater. Copy the code from inside your function (do not copy the first line or the last end, just the code inside) and paste into the first code box below. Use the Run Function button to make sure you've copied the code over correctly and it works before submitting. Use the feedback to help you determine how to adjust your thresholds. Function: ``` function [BW, maskedRGBImage] = segmentMeltwater(RGB) % copy the code inside your function here end ```](https://gotit-pro.com/wp-content/uploads/2023/10/16891987-0fcf-4a3f-9352-c1af3a659f17.png)
![2.1 Problem Statement Recently at a University, there has been a huge increase in the number of enrollments. All records of students are entered into a flat file by the registrar when the students register and updated accordingly if there is a need. As a result of the increase in enrollments, this file now has a lot of records. Hence, the statistical officers are now finding it hard to analyze this file to produce various reports for the management. You are required to write a program which will read in this file and produce various reports as outlined. Input File: The input file called StudentRec.txt contains a list of student records. Each record is on a single line and the fields are separated by spaces. The names of the fields are: - Lastname - string - Firstname (initial) - char - ID# - integer - Year of birth - integer - GPA - double An example record may have the following form: Doe J 2021123419903.2 And the format of the actual file is shown below. (Note: the file doesn't show all records and for clarity, fields here are shown separated by tabs, but in the actual file they are separated by spaces). Assume that the file can have a maximum of 300 records. - The first three lines are just header lines and can be discarded - Student id contains an 8-digit number. - Year of birth contains a 4-digit number - GPA is a one decimal place number between 0 - 4 Program Requirements: 1. You must read this file from the current directory and store the records of students into appropriate arrays. 2. Your program should then be able to process the following commands. i.e. the program should provide the user with the following menu. - 1. Print the entire list as per the read file. - 2. Print the entire list with the inclusion of last name initial and age. - 3. Print the list sorted by GPA. - 4. Print the list of students which match a given lastname initial. - 5. Calculate and display the corresponding degree classification (according to GPA) as provided in Table A. - 6. Produce a file called Enrollments.txt (in the current directory), with all the details [Last name, Lastname Initial, Firstname Initial, ID#, Age, GPA, and degree classification]. - 7. Exit the program. Explanation of each menu item. 1. Print the entire class list. This menu item is selected by typing 1, and it should simply print the contents of the file in a suitable format on the screen. (Fields (columns) to display in output are: Last name, Firstname Initial, ID#, Age, GPA, and degree classification) 2. Print the entire class list with the inclusion of last name initial and age. This menu item is selected by typing 2, and it should simply print the contents of the file in a suitable format on the screen with the inclusion of last name initial and age. (Fields (columns) to display in the output are: Last name, Lastname Initial, Firstname Initial, ID#, Age, and GPA) 3. Print the class list sorted by GPA. This menu item is selected by typing 3. The program then prints the list in ascending order of GPA. (Fields (columns) to display in the output are: Lastname Initial, ID#, and GPA) 4. Print the class list of students which match a given lastname initial. The user selects this option by typing 4. Then the user is asked to enter the search initial. If there are students who have that initial, the program prints their record. Otherwise, if no students have last names matching the search initial, a "no matching record found" message is displayed. (Fields (columns) to display in the output are: lastname and id) 5. Calculate and display the corresponding degree classification as per GPA as provided in Table A. The user selects this option by typing 5. The program then calculates and displays the degree classification according to GPA. The format of the resultant display is shown below: [The table (Table A) for degree classification as per GPA is given at the end of this project description] 6. Produce a file called Enrollments.txt (in the current directory), with all the details [Last name, Lastname Initial, Firstname Initial, ID#, Age, GPA, and degree classification]. The user selects this option by typing 6. The program then generates a file "Enrollments.txt" in the current directory with the following details [Last name, Lastname Initial, Firstname Initial, ID#, Age, GPA, and degree classification]. 7. Exit the program. User selects this option by typing 7. This is when the program should end. Note: After each command is processed (except menu 7), the program must display the menu options again. Function to sort an array: There are many algorithms to sort an array according to an ascending or descending criterion. However, we will use the following as it is easiest to understand and CODE. Minimum Element Sort: Go through the array and find the smallest element. Swap it with the first element of the array. Now find the smallest element of the rest of the array and swap it with the second element of the array. And so on. Rather more formally: to sort (x0, ..., xn) into ascending order for i=0 to n-1 begin find the smallest of (xi, ..., xn)](https://gotit-pro.com/wp-content/uploads/2023/10/862ab19f-4f11-467e-ac53-58e56050ee1f.jpg)