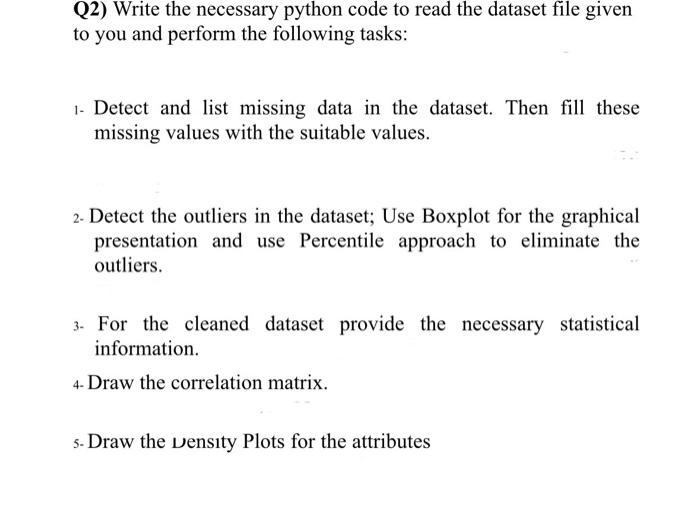
Use a Boxplot for the graphical presentation and use the Percentile approach to eliminate the outliers
Showing the single result
-

Q2 Write the necessary python code to read the dataset file given to you and perform the following
Waived! Original price was: $10.00.$5.00Current price is: $5.00. Add to cart
Showing the single result
