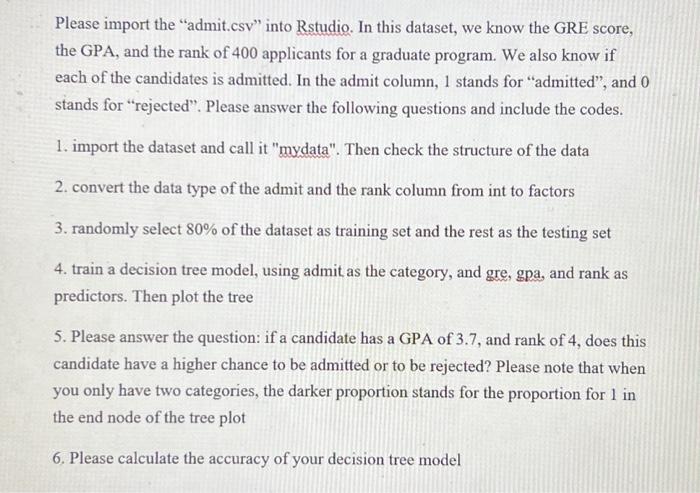
Please import the “admit.csv” into RStudio. In this dataset, we know the GRE score, the GPA, and the rank of 400 applicants for a graduate program. We also know if each of the candidates is admitted. In the admit column, 1 stands for “admitted”, and 0 stands for “rejected”. Please answer the following questions and include the codes.
1. Import the dataset and call it “mydata”. Then check the structure of the data.
2. Convert the data type of the admit and the rank column from int to factors.
3. Randomly select 80% of the dataset as the training set and the rest as the testing set.
4. Train a decision tree model, using admit as the category, and GRE, GPA, and rank as predictors. Then plot the tree.
5. Please answer the question: if a candidate has a GPA of 3.7 and a rank of 4, does this candidate have a higher chance to be admitted or to be rejected? Please note that when you only have two categories, the darker proportion stands for the proportion for 1 in the end node of the tree plot.
6. Please calculate the accuracy of your decision tree model.

 25% off with code “SUMMER”


![(b) Modify the program in Q3(a), with the following new rules: - Players will need to win 3 games to become the overall winner. - Implement a penalty - for the player who skipped, entered an incorrect expression, or entered an expression that evaluated to the wrong result, will draw 2 random digits into their hand. - The player who loses the game will be awarded a "Skip" card in the next game. With the "Skip" card, the player can hit < Enter > to skip, without a penalty. - If not utilized, the "Skip" cards CANNOT be carried forward to the next game. Illustration of the "new" game on the left column, with the rules of the game explained on the right column: Enter player: Alan Enter player: Betty Enter player: Starting hand (number) of digits: 4 Let's play... Game 1 Round 1: Result 6 Betty's hand: [5,2,1,1] Enter expression: 5+1 Correct! Betty's hand: [2,1] Alan wins this game in 4 rounds!! Overall game score: Alan 1, Betty 0 Let's play... Game 2 Round 1: Result 5 Betty's hand: [3, 6, 5, 7, 'S'] Enter expression: Skipped with no penalty!! Betty's hand: [3,6,5,7] Alan's hand: [2,1,2,1] Enter expression: Skipped and 2 digits added to hand Alan's hand: [2,1,2,1,4,7] Betty wins this game in 5 rounds!! Overall game score: Alan 1, Betty 1 Let's play... Game 3 Round 1: Result 6 Betty's hand: [1, 2, 8, 7] Enter expression: 8-2 Correct! Betty's hand: [1, 7] Computer randomized the play sequence and will stay the same for every game/round End of game, if no overall winner, continue to play another game. Loser will be awarded a "Skip" card in the next game. "S" represents the "Skip" card awarded to Betty. No penalty for Betty as she has a "Skip" card. Hit < Enter > key to skip if cannot form an expression. In this case, the player who skipped will draw 2 random digits into their hand. End of game, if no overall winner, continue to play another game. Loser will be awarded a "Skip" card in the next game.](https://gotit-pro.com/wp-content/uploads/2023/10/1fa83cc6-5755-4d51-b5f6-f4335b49f1c8.jpg)

![Large Integers Part #1 Largelnteger Class An array can be used to store large integers, one digit at a time. For example, the integer 1234 could be stored in the array num by setting num[0] to 1, num[1] to 2, num[2] to 3, num[3] to 4. However, for this class implementation, you might find it more useful to store the digits backward; that is, place 4 in num[0], 3 in num[1], 2 in num[2], and 1 in num[3]. For the sake of simplicity, we will be storing and manipulating only with positive large integers. Implement a class named Largelnteger that stores a large integer as an array of its digits. Class must extend HasState class (provided). This is needed to make sure clone() method is written correctly. Class must have the following: - Fields - Constant arraySize must be set to 23 - Partially filled array of integers of length 23 - int digitCount keeps the number of digits in large integer, e.t. how many elements of the partially filled array are used to store the number - No-argument constructor that stores number 0 in the array. Sets digitCount to 1 - Constructor that takes a string as a parameter. The constructor parses the given string and converts it into Large Integer by storing digits in the partially filled array. - Create a new custom Exception class called LargelntegerNumberFormatException. The constructor throws exceptions of this type when - string is too long to be stored as a 23-digit number or - when string is empty or - when the string contains non-digits and thus cannot be converted into a number. - Constructor that takes a number of type long as a parameter and builds an object from it by storing digits in an array. - This constructor also throws a custom LargelntegerNumberFormatException when a parameter passed to the constructor is a negative number. - getDigitCount() accessor to the digit count variable. - toString() method that converts an array into a string of numbers in the correct order. Number 12345 is converted into a string "12345" - add(Largelnteger) method that returns the sum of this integer and the one passed as a parameter. The method adds two large integers by implementing the usual "paper and pencil" addition algorithm. This is when the backward storage arrangement of those numbers in arrays will pay off. Carry-over will be easier to do when the integer is stored backward. - Create another custom Exception class called LargelntegerOverflowException. If the resulting number is more than 23 digits long, the add() method throws a LargelntegerOverflowException type exception. - Implement clone() method. - Make your class implement Relatable interface. Code of the interface is provided. Implement all three methods of the Relatable interface. Part #2 Polymorphic Class This class exists only to house one static method called isSorted(). The method must take an array of objects of type Relatable and check if the array is sorted with the help of methods of Relatable interface. The method returns true if the array is sorted and false if it is not. The whole purpose of this exercise is to illustrate the concept of polymorphism. The purpose of this class is to house three static methods. 1. Method void writeLargelntegerArray(Largelnteger[], String) takes an array of Large Integers and a name of a file as parameters. The method writes the contents of the given array into the given binary file (in binary mode). The method throws IOExceptions. The IOExceptions may originate in the methods but must not be handled. Instead, they must be propagated to the calling code. - Make sure to add implements Serializable to the Largelnteger class header. Binary IO will fail to work without that. 2. Method Largelnteger[] readLargelntegerArray(String) method reads the contents of a binary file with the given name as an array of objects of type Largelnteger. Assume you do not know the amount of data in the file. Read data one Largelnteger object at a time and store the objects in ArrayList first. After the end of the file has been reached, convert the ArrayList into a regular array of objects that can be returned from the method. - Please study EOFDemo.java code example to learn how to use exceptions when checking for the end of the file while reading from a binary file. - This method also throws IOExceptions. The IOExceptions may originate in the methods but must not be handled. Instead, they must be propagated to the calling code. 3. Method Largelnteger addLargelntegersFromFile(String) takes a text file name as a parameter. It reads an arbitrary number of strings of text from the file, converting them into Largelntegers as it reads. The Large Integers are added one by one to the running total with the help of add() method. The sum of all the Large Integers stored in the file as strings is then returned from the method. - The structure of the file may be imperfect. Some strings may contain corrupted data and will fail to be converted into Largelnteger. This must not interrupt the process of reading from the file. The corrupted string must be skipped over, and the next string must be read and converted. Use a try/catch block to catch and ignore LargelntegerNumberFormatException. - The sum of all numbers stored in the file may become too big to be stored in a Large Integer. In that case, a LargeIntegerOverflowException exception will be thrown by the add() method. If this happens, catch the exception and return a null value from the method. - This method also throws IOExceptions. The IOExceptions may originate in the methods but must not be handled. Instead, they must be propagated to the calling code.](https://gotit-pro.com/wp-content/uploads/2023/10/a2443259-5cf9-45ff-9909-fdcfa036711f.png)
Gary Spinell –
It was amazing work and in a very short time.
Lynn Prytula –
great work as usual thanks
Garfield Fabricius-Davies –
I have received phenomenal service that is consistent. The quality of work is A+ and the prices are very reasonable.
Nancy Del –
The assignment was excellent and I have scored 100 percent. I am very proud and happy with you.
Megan Mowles –
Excellent, thank you! Got solution extremely fast, within minutes.
Safir Adeni –
I really love the quality of the assignments. They are great so far. Accurate.