5.3. Write a program that displays editable bar graphs.
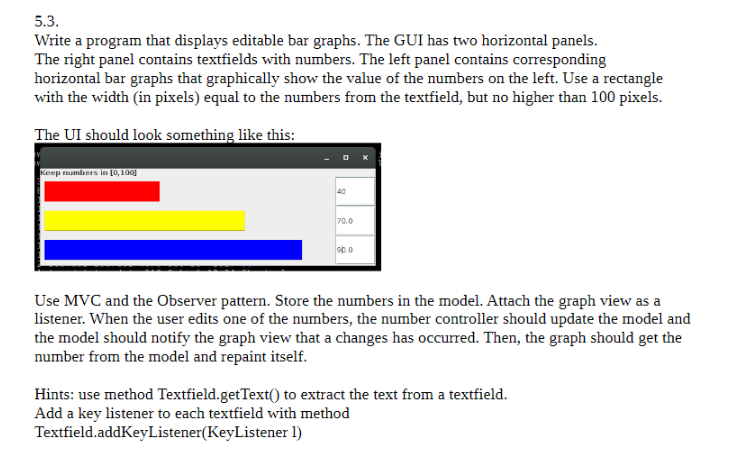
The GUI has two horizontal panels.
The right panel contains textfields with numbers.
The left panel contains corresponding horizontal bar graphs that graphically show the value of the numbers on the left.
Use a rectangle with the width (in pixels) equal to the numbers from the textfield, but no higher than 100 pixels.
The UI should look something like this:
Use MVC and the Observer pattern.
Store the numbers in the model.
Attach the graph view as a listener.
When the user edits one of the numbers, the number controller should update the model and the model should notify the graph view that a change has occurred.
Then, the graph should get the number from the model and repaint itself.
Hints: use method TextField.getText() to extract the text from a textfield.
Add a key listener to each textfield with method TextField.addKeyListener(KeyListener l)
 All Study Co-Pilots are evaluated by Gotit Pro as an expert in their subject area.
